Investors were already wrestling between optimism and pessimism due to the current public health and economic situation. But now, they have a new battle to monitor: Reddit vs. The Hedge Funds. Earnings came in strong last week and will likely do the same this week, but it seems like nobody cares. All anybody seems to be focused on is GameStop GME , AMC, and now Silver. How in the world did a message board of renegade retail investors take on hedge funds and win? Is this trend going to last, or is it just another example of a speculative market bubble? Time will tell what happens in the short-term, but we’ve put together a list of trending ETFs this week that can help you diversify your portfolio and potentially mitigate risks. Q.ai’s deep learning algorithms have identified several ETFs to look out for this week based on their fund flows over the last 90 days, 30 days, and seven days. We have identified two Top Buys, two Unattractives, one Top Short, and three interesting Unrated ETFs this week.
Sign up for the free Forbes AI Investor newsletter here to join an exclusive AI investing community and get premium investing ideas before markets open.
Top Buy
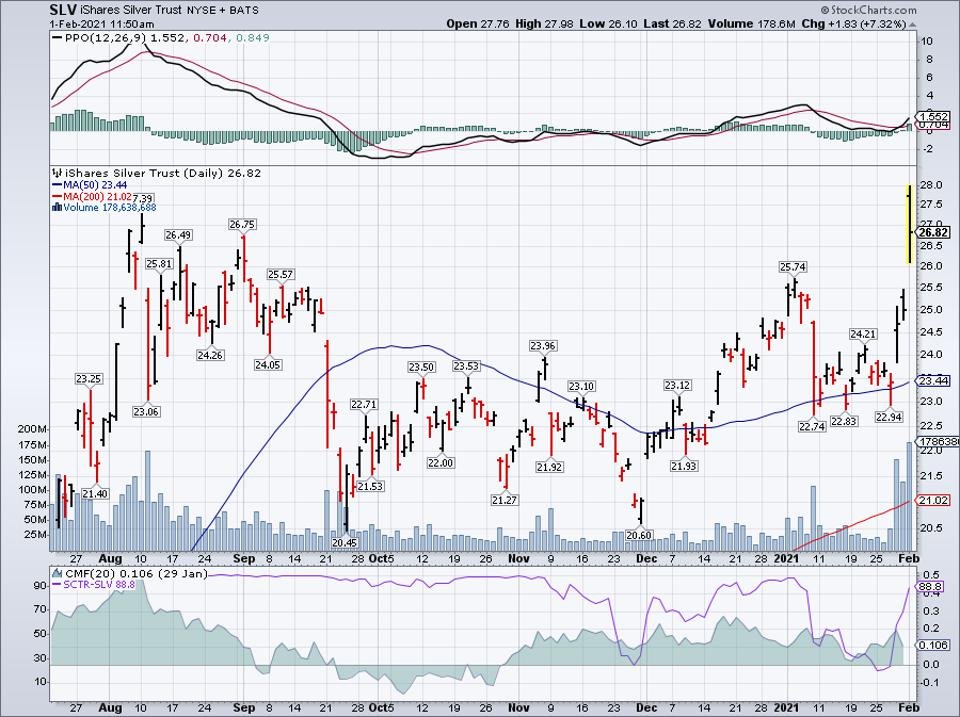
iShares Silver Trust (SLV)
The iShares Silver Trust is our first Top Buy ETF SLV this week. Gaining buzz due to retail investors looking for the next squeeze and imminent stimulus that could send the dollar downwards and precious metals upwards, this ETF aims to reflect the performance of the price of silver. The ETF also provides a convenient and cost-effective way to invest in physical silver. With $16,496,303,126.39, the ETF is on the smaller side. Its fund flows have been consistently positive, with a 90-day fund flow of $1,068,272,620.00, 30-day fund flow of $1,196,470,290.00, and 1-week fund flow of $695,341,665.00. With a net expense ratio of 0.5%, it is certainly not cheap to own.
Simple moving average of iShares Silver Trust (SLV)
Stock Charts
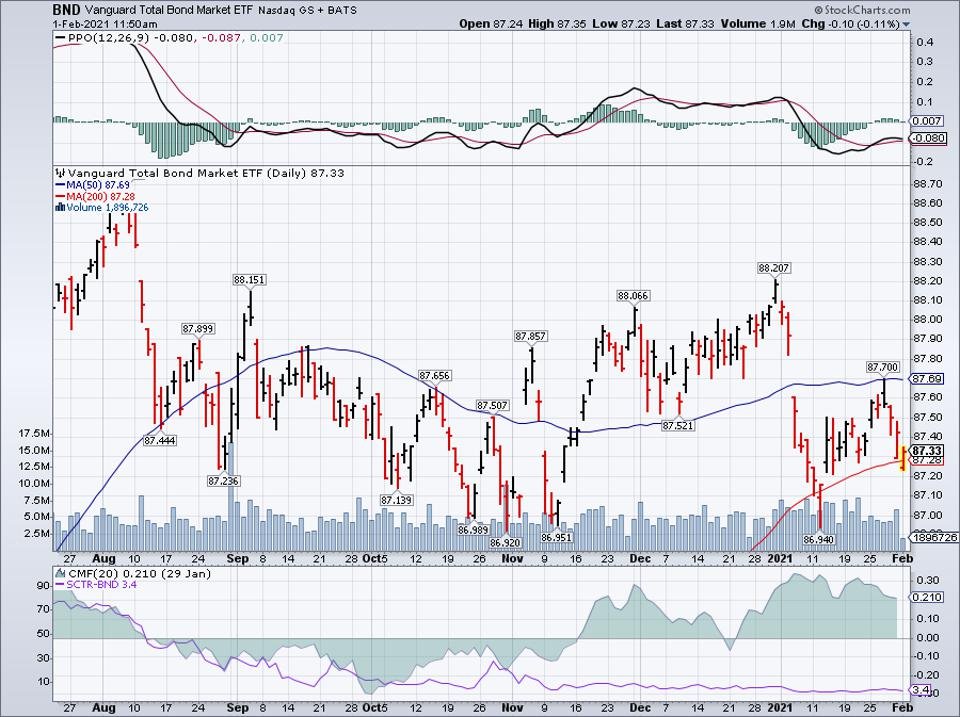
Vanguard Total Bond Market ETF (BND)
How things can change. After appearing as a Top Short three weeks ago, the Vanguard Total Bond Market ETF BND is our other Top Buy this week. This ETF seeks to give investors exposure to a broad index of taxable US dollar denominated bonds. With $70,221,978,852.48, this ETF is more on the medium-sized side. It has seen consistent fund flows, with a 90-day fund flow of $6,905,660,000.00, 30-day fund flow of $2,966,281,000.00, and 1-week fund flow of $603,682,000.00. With a net expense ratio of 0.05%, this ETF is also extremely cheap.
Simple moving average of Vanguard Total Bond Market ETF (BND)
Stock Charts
Unattractive
Vanguard Total Stock Market ETF (VTI)
The Vanguard Total Stock Market ETF VTI is our first Unattractive ETF this week. This ETF aims to track the broader stock market, across all indices. The ETF also includes stocks of all cap sizes, and both growth stocks and value stocks. The ETF is on the larger side with $204,358,406,608.86 AUM. It has seen consistently positive fund flows, with a 90-day fund flow of $14,239,401,158.86, 30-day fund flow of $3,896,697,174.37, and 1-week fund flow of $650,341,099.72. Its net expense ratio of 0.03% is also very cheap and reasonable.
Simple moving average of Vanguard Total Stock Market ETF (VTI)
Stock Charts
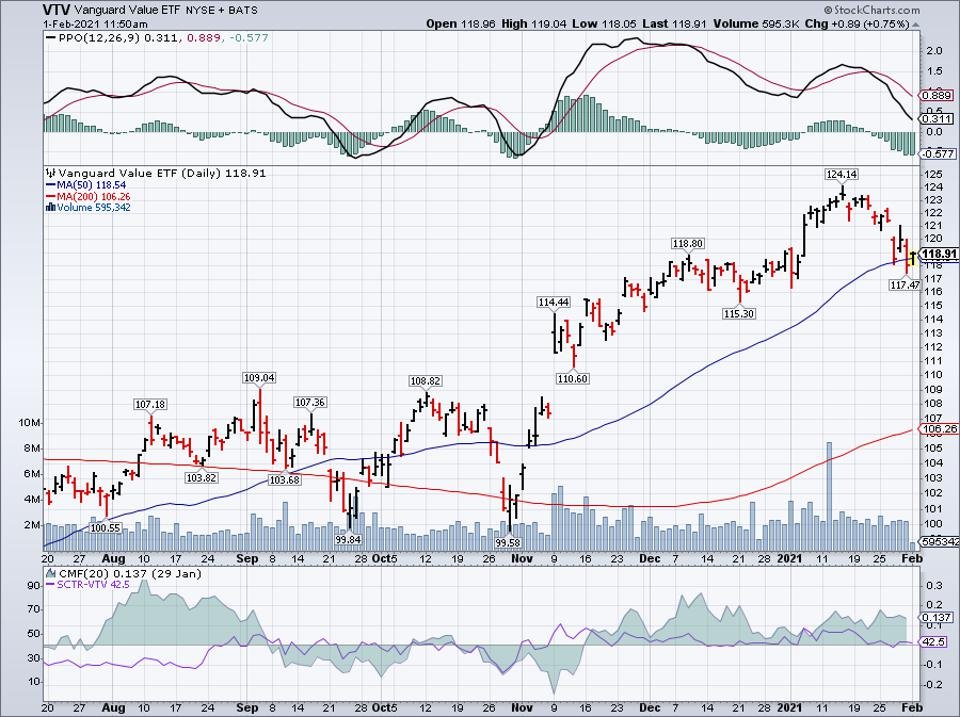
Vanguard Value ETF (VTV)
The other Unattractive rated ETF this week is the Vanguard Value ETF. This ETF aims to track an index of large-cap US value stocks such as Berkshire Hathaway BRK.B , Johnson & Johnson, Procter & Gamble PG , United Health, and JP Morgan. The ETF is mid-sized with $62,137,842,516.96 AUM, and has seen consistent fund flows. The ETF has a 90-day fund flow of $3,944,351,867.59, a 30-day fund flow of $1,218,028,505.77, and a 1-week fund flow of $374,424,204.41. Its net expense ratio of 0.04% is also very reasonable.
Simple moving average of Vanguard Value ETF (VTV)
Stock Charts
Top Short
iShares Core U.S. Aggregate Bond ETF (AGG)
The iShares Core U.S. Aggregate Bond ETF AGG is our sole Top Short this week. This ETF aims to track an index composed of the total U.S. investment-grade bond market. This ETF is also midsized in terms of AUM with $86,263,548,503.00 AUM. The ETF has also witnessed consistent fund flows with a 90-day fund flow of $5,296,348,790.00, 30-day fund flow of $1,783,876,100.00, and 1-week fund flow of $469,753,920.00. Its net expense ratio of 0.05% is also reasonable.
Simple moving average of iShares Core U.S. Aggregate Bond ETF (AGG)
Stock Charts
Unrated
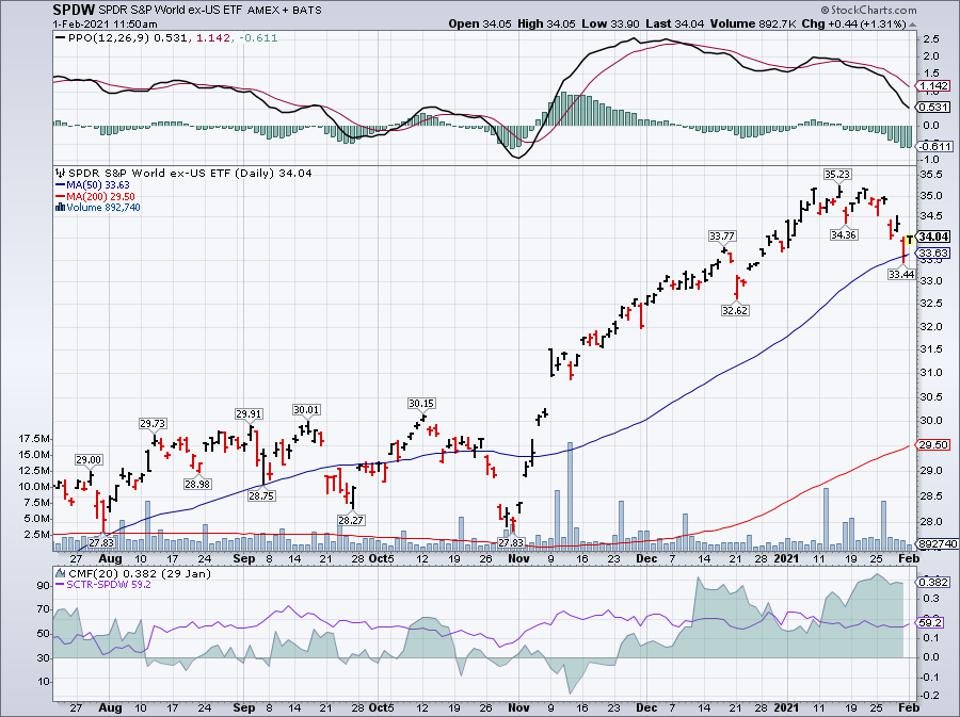
SPDR Portfolio Developed World ex-US ETF (SPDW)
The SPDR SPDW Portfolio Developed World ex-US ETF is our first Unrated ETF this week. The ETF aims to track an index of developed markets excluding the U.S., and mitigates country-specific risk through offering broad exposure to developed international markets. The ETF is smaller-sized with $9,578,293,276.64 AUM, and has seen consistent fund flows. The ETF has a 90-day fund flow of $439,190,539.20, a 30-day fund flow of $430,348,122.00, and a 1-week fund flow of $367,683,694.20. Its net expense ratio of 0.04% is also very reasonable.
Simple moving average of SPDR Portfolio Developed World ex-US ETF (SPDW)
Stock Charts
Vanguard FTSE Developed Markets ETF (VEA)
The Vanguard FTSE Developed Markets ETF VEA is our second Unrated ETF. It is similar to the SPDR Portfolio Developed World ex-US ETF in that it aims to provide investors with exposure to developed markets outside of the U.S., with a specific focus on diversified stocks of large-, mid-, and small-cap companies located in Canada and the major markets of Europe and the Pacific region. The ETF is mid-sized with $87,506,458,403.56 AUM, and has seen consistent fund flows. The ETF has a 90-day fund flow of $1,302,688,195.63, a 30-day fund flow of $990,678,667.76, and a 1-week fund flow of $367,711,872.24. Its net expense ratio of 0.05% is also very reasonable.
Simple moving average of Vanguard FTSE Developed Markets ETF (VEA)
Stock Charts
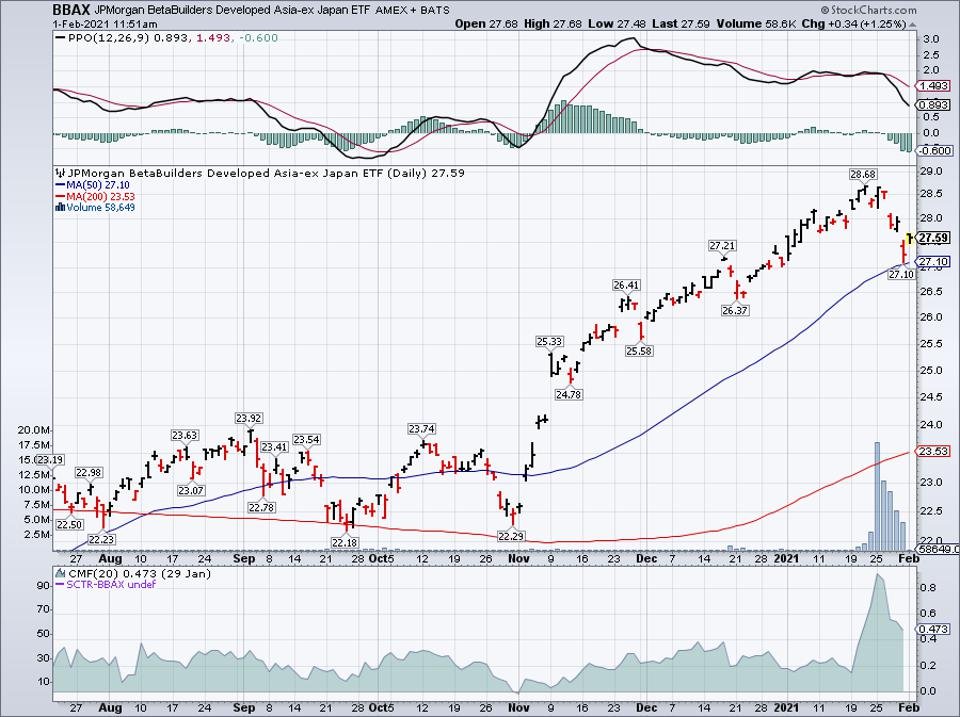
JPMorgan BetaBuilders Developed Asia ex-Japan ETF (BBAX)
The JPMorgan BetaBuilders Developed Asia ex-Japan ETF BBAX is our final Unrated ETF this week. This ETF is a free-float adjusted market-cap weighted index consisting of stocks from Australia, Hong Kong, New Zealand and Singapore. The ETF is the smallest on this week’s list with $2,918,522,941.93 AUM, and has seen consistent fund flows. The ETF has a 90-day fund flow of $1,188,136,000.00, a 30-day fund flow of $1,178,856,000.00, and a 1-week fund flow of $1,161,720,000.00. Its net expense ratio of 0.19% is not the cheapest to own, but it’s still not horrible.
Simple moving average of JPMorgan BetaBuilders Developed Asia ex-Japan ETF (BBAX)
Stock Charts
Liked what you read? Sign up for our free Forbes AI Investor Newsletter here to get AI driven investing ideas weekly. For a limited time, subscribers can join an exclusive slack group to get these ideas before markets open.


